
Since the onset of COVID-19, and through a tumultuous period in markets, commodity hedge funds have quietly delivered an incredible performance, outpacing most, if not all, major investment categories, including the much-publicized returns delivered by trend followers.
Using data from our Bridge Alternatives Commodity Hedge Fund Indices (BACHFIs), specifically the Equally Weighted (EW) arrangement 1, we find that from March 2020 onwards (the month during which the WHO declared COVID-19 a pandemic) the index delivered an annualized compound return of 20.16% on 6.19% annualized risk–a 3.26 return/risk ratio.
Over this same period:
- commodity futures markets experienced an abrupt drawdown and recovery
- index member assets under management more than doubled, today totaling over $19B
- virtually all 15 index members reached or are nearing self-determined capacity limits
What follows is a detailed examination of commodity hedge funds (as represented by the BACHFIs), with emphasis on post-COVID performance. We review quantitative qualities of the sector relevant to institutional investors and compare our indices’ performance to commodity futures markets and major benchmarks. We continue with analysis of industry assets under management, style trends, and investor behavior. Finally, we take stock of the work and conclude with opinions on the industry’s future.
Affording this research are the relationships, access, and data behind the BACHFIs. Bridge started this project to provide an alternative and data-supported narrative for the sector. Now, nearly 10 years later, we happily find the industry healthy, diversified, and growing.
Commodity hedge funds, the asset class
Launched in January 2014, The BACHFIs comprise the 15 largest commodity hedge funds. These managers employ a commodity-focused, long/short, and fundamental trading approach, primarily utilizing commodity futures contracts. The indices are rebalanced annually and reported in an asset weighted (AW) and equally weighted (EW) fashion. With few exceptions, these series model the institutional and investable fund activity in commodity markets.
| Asset Weight | Equal Weight | |
|---|---|---|
| Ann. Compound RoR | 7.85% | 8.40% |
| Ann. Risk | 5.96% | 5.41% |
| Ratio | 1.32 | 1.55 |
The analysis below is restricted to our index and its 15 members. While a fraction of all commodity hedge funds live today, our subset likely manages the bulk of the industry’s assets, especially those owned by institutions. Typical of investment businesses, assets are distributed via a power law, with the minority holding the majority.
Therefore, conclusions drawn may or may not extend to smaller funds2. Still, we believe the BACHFIs uniquely represent the experience of institutional investors and the managers they’ve selected since many members do not report data elsewhere.
Quantitative features
For those less familiar with our index and/or commodity hedge funds, we begin by highlighting several quantitative features of both index and constituent-level data. Several statistics stand out:
Low volatility
Commodity hedge funds have arguably received a mixed reception from the institutional community historically. Notable fund closures during the 2010s, linked to the depressed volatility and opportunity of that period, are partially responsible. It is likely the industry’s reputation for elevated idiosyncratic volatility is also a factor. However, the indices seem to tell a different story.
However, while our indices do exhibit very low volatility, the reason is not that members are delivering particularly low-risk returns. Instead, we find the average pairwise correlation–or the average of correlations measured between all manager pairs–to be essentially zero (Figure 1).
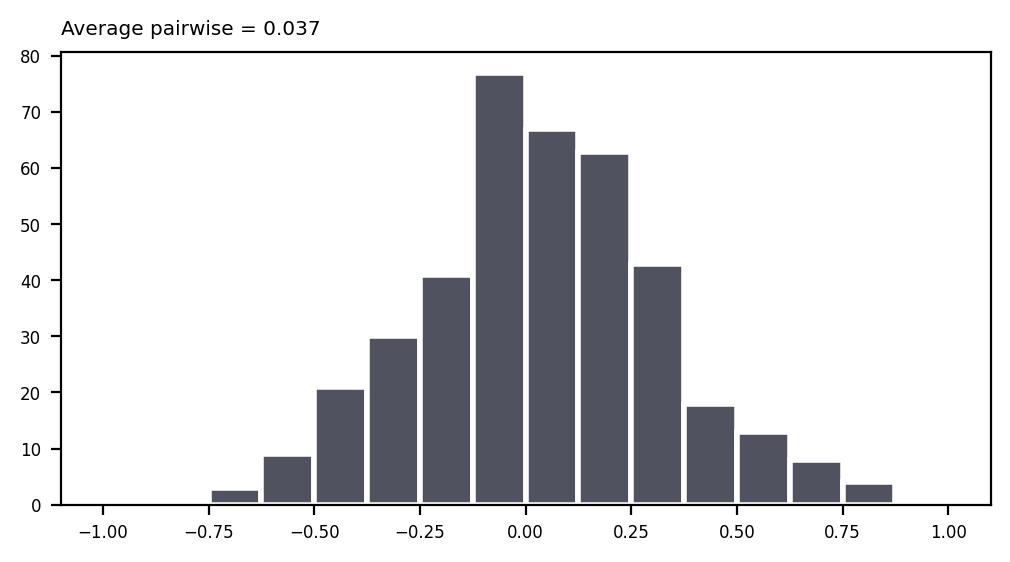
This quality of the membership, which likely extends to the broader industry, has the effect of significantly reducing volatility at the index level–the “portfolio effect” at work. Individual manager volatilities vary and certainly can be volatile (Figure 2), but conclusions regarding commodity manager volatilities should be drawn carefully. Many of these managers offer separately managed accounts (SMAs), providing clients with some control over the volatility target.
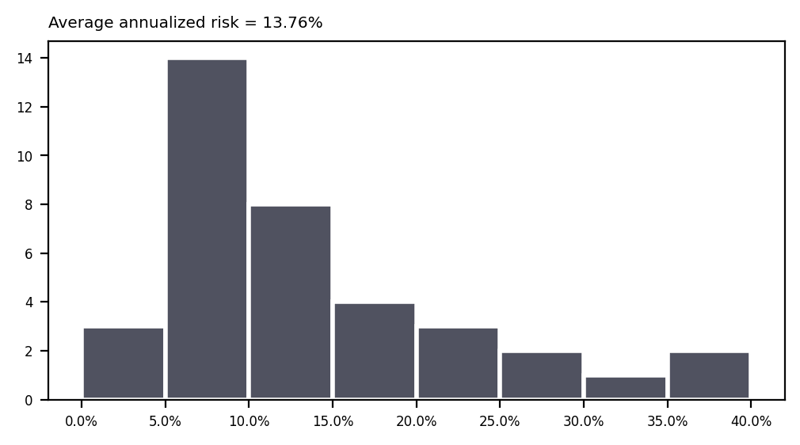
Figure 2: Histogram of member manager annualized volatilities. Results only depict data used to construct the index and not each manager’s full track record. (Source: Bridge Alternatives)
Low correlation to benchmarks
As shown in Table 2, commodity hedge funds delivered very low correlations to stocks (S&P 500 Total Return), trend followers (Soc Gen Trend Index), and even to commodity futures contracts (Bloomberg Commodity Index).
| EW | AW | SP500 TR | SG Trend | BCOM | |
|---|---|---|---|---|---|
| Equal Weight | |||||
| Asset Weight | 0.88 | ||||
| SP500 TR | 0.04 | 0.13 | |||
| SG Trend | 0.25 | 0.26 | -0.04 | ||
| BCOM | 0.07 | 0.17 | 0.44 | -0.04 |
High risk-adjusted returns
Bolstered by good performance since 2020, the BACHFIs have delivered high risk-adjusted returns relative to benchmarks. Most impressive, these returns occurred during a period where the BCOM Index (i.e. commodity futures) lost value (Table 3).
| EW | AW | SP500 TR | SG Trend | BCOM | |
|---|---|---|---|---|---|
| Ann. RoR | 8.40% | 7.85% | 10.79% | 6.03% | -0.89% |
| Ann. Risk | 5.41% | 5.96% | 15.26% | 11.51% | 14.54% |
| Return / Risk Ratio | 1.55 | 1.32 | 0.71 | 0.52 | -0.06 |
Figure 3 plots manager return/risk ratios using only data collected during their tenure as index members (not full track records). The average of this distribution (0.40) is notably lower than the Equally Weighted index (1.55) itself. However, this difference is fully explained by the low pairwise correlations, which drive portfolio volatility lower (and return/risk ratios higher) as more disparate assets are combined.
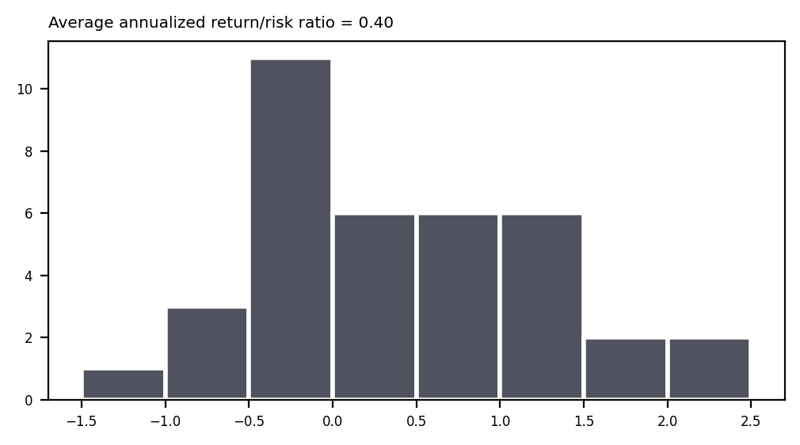
Figure 3: Histogram of member manager annualized return/risk ratios. Results only depict data used to construct the index and not each manager’s full track record. (Source: Bridge Alternatives)
Expanding this point, we examine the correlation properties among trend following strategies. While trend followers also trade futures contracts, they are not restricted to the commodity sector and tend not to employ fundamental models, preferring technical ones instead. Still, in the broad world of alternatives, commodity funds and trend followers are first cousins.
How do the correlation properties compare between these relatively similar strategies?
Because portfolios of assets realize volatilities less than the sum of their parts–a tenet of finance–we know the distribution of individual trend follower return/risk ratios underlying the Soc Gen Trend Index would reveal an average lower than the index itself (0.52). Since trend following strategies tend to exhibit relatively high pairwise correlations, it is probable the average return/risk ratios for both trend followers and commodity hedge funds are similar (about 0.40).
Put differently, if you were to pick one manager from each category (commodity versus trend), the results might be comparable. However, because of the pairwise correlations within each sector, the performance characteristics of portfolios comprised of these assets diverge meaningfully.
Investor opportunity sets
Experienced alternatives investors know finding concurrently liquid, performant, and diversifying investments is extremely challenging. Trend following strategies have emerged as one such tool, and, given similar sample return/risk ratios (on average) and instrumentation (futures contracts), it is tempting to group commodity hedge funds with trend followers, adding another option to the short list of “liquid diversifiers.” But this misses a key point.
Commodity hedge funds exhibit a rare combination of good performance and low pairwise correlation–trend following cannot claim the latter. From an investor’s perspective, this is ideal: more capital can be allocated across more opportunities, given the same risk budget. This suggests a diversified approach within commodity hedge funds is optimal, with broad portfolios containing complimentary managers of varying styles and expertise. It is this strategy we see most commonly adopted among our institutional clients.
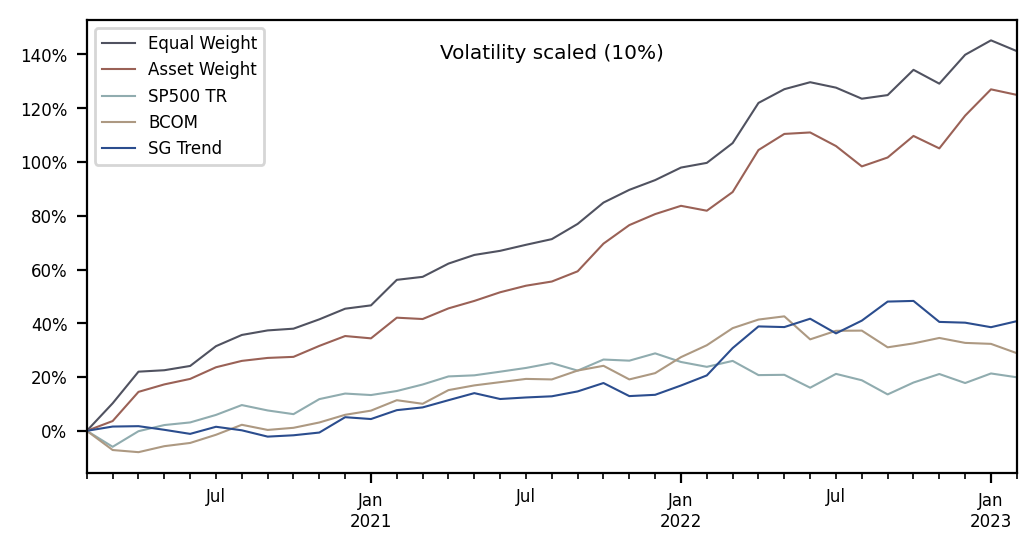
Further evidence of the value of this quality is found in Figure 4, which plots the BACHFIs against major benchmarks in an as-reported fashion, alongside one where volatility is normalized across each series to 10% annualized (i.e. a constant risk budget).
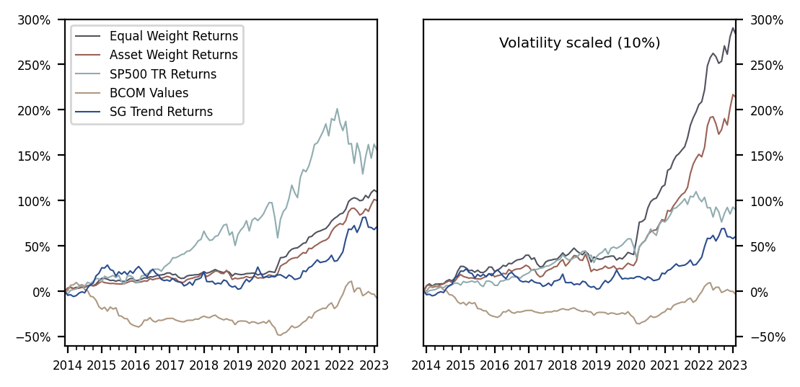
Throughout the remaining analysis, we will risk-normalize performance where possible. These transformations are backward-looking and only useful for comparative purposes. Additionally, while adding volatility can be harder than subtracting it in practice, given the investment vehicle customization tools available to institutions today (through SMAs, fund of one structures, etc), we believe risk-adjusted returns (as opposed to reported returns) are most correlated with opportunity.
A structural break in 2020
From the inception of the BACHFIs in Jan 2014 through Feb 2020, the Bloomberg Commodity (BCOM) Index experienced a protracted bear market (see Table 4). Interestingly, during the same period, commodity hedge funds fared well, delivering relatively strong risk-adjusted returns.
| Equal Weight | Asset Weight | SP500 TR | SG Trend | BCOM | |
|---|---|---|---|---|---|
| Ann. RoR | 3.11% | 2.52% | 10.13% | 2.41% | -8.01% |
| Ann. Risk | 4.32% | 5.03% | 11.84% | 11.47% | 12.08% |
| Ratio | 0.72 | 0.50 | 0.86 | 0.21 | -0.66 |
However, a closer examination of the BACHFIs’ history reveals a change in performance after February 2020. Table 5 illustrates the magnitude of the changes following the onset of COVID-19, primarily driven by stark increases in return.
| Weighting | Statistic | Before (n=74) | After (n=36) | Change |
|---|---|---|---|---|
| Asset | Ann. Ror | 2.52% | 19.71% | 17.19% |
| Ann. Risk | 5.03% | 6.59% | 1.56% | |
| Ratio | 0.50 | 2.99 | 2.49 | |
| Equal | Ann. Ror | 3.11% | 20.16% | 17.05% |
| Ann. Risk | 4.32% | 6.19% | 1.87% | |
| Ratio | 0.72 | 3.26 | 2.54 |
Reinforced by Figure 5, this post-COVID period of performance stands apart, significantly outpacing stocks, commodity futures, and trend followers.
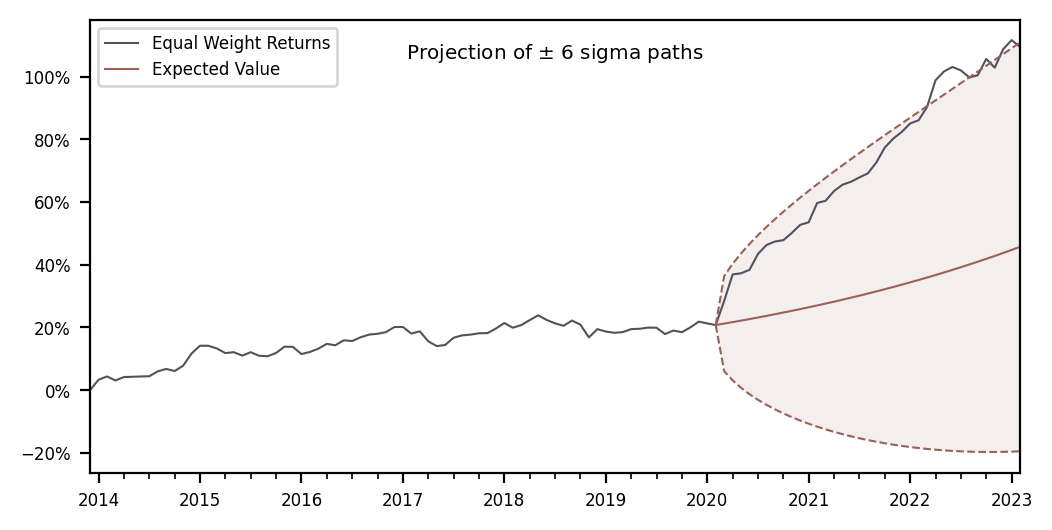
While subject to several mathematical assumptions, from the perspective of an investor evaluating commodity hedge funds in February 2020, the path that followed was a more than 6 sigma event (see Figure 6). Put simply, this was exceedingly unexpected provided available ex-ante evidence.
Post-COVID context
The post-COVID period featured exceptional supply chain stress, historic monetary policy, and unexpected geopolitical events. Throughout, it seems, commodity hedge funds found favorable market conditions. While understanding the market-by-market reasons why certain funds performed better/worse than expectations is beyond the scope of this paper, we can add higher-level context: What did commodity futures markets do during this time? And how did other strategies perform within the same markets?
Our aim is to better understand the post-COVID opportunity set and how commodity hedge funds managed it. As investors plan for similar or different market environments going forward, we also hope to help them establish more accurate expectations of the sector and the roles it may serve through various regimes.
Commodity futures markets
During this post-COVID period, commodity futures markets experienced a meaningful recovery from more than 20-year lows established in April 2020. Figure 7 plots the lifetime returns of the BCOM Index with recoveries highlighted, alongside a chart affording easier comparison among the periods.
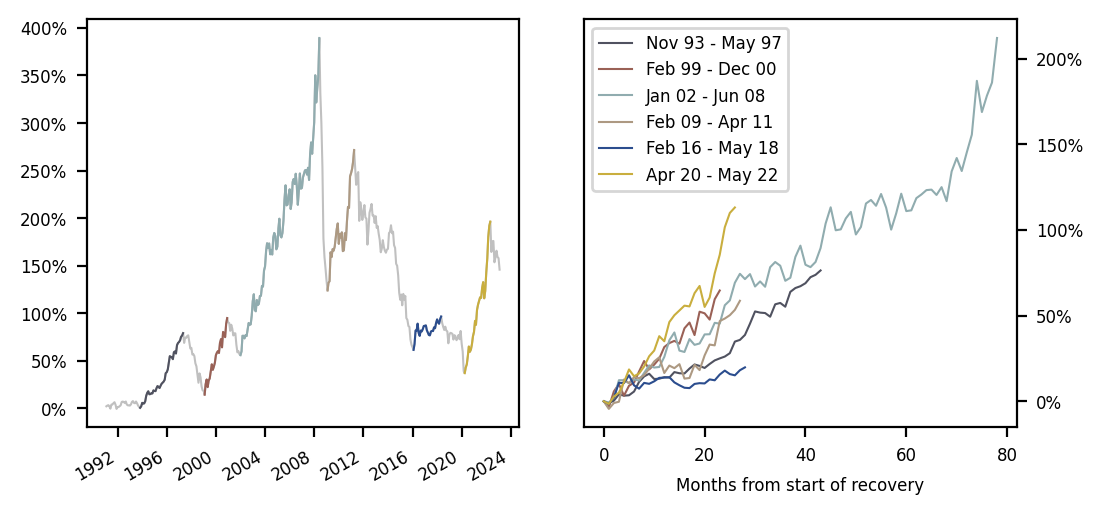
Though shorter than the notable bull markets of the mid-90s and mid-2000s, the most recent recovery (starting in April of 2020) was significant. However, prices have since declined, and current index levels remain far below historical highs.
BCOM sector returns through the recovery were all positive, though varied. Figure 8 depicts the underlying sectors against the BACHFIs in a normalized fashion.
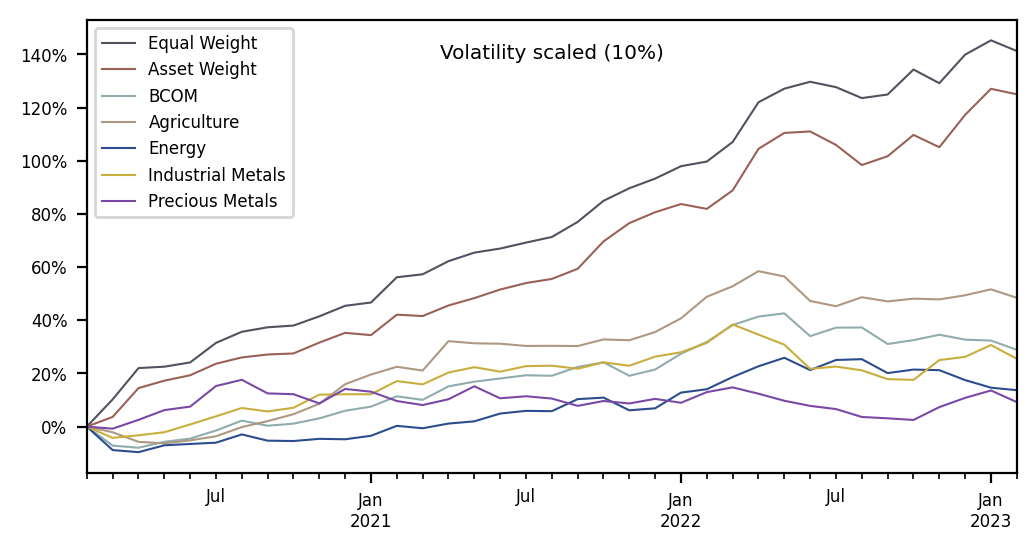
Importantly, the BACHFIs experienced essentially zero correlation with the BCOM index and its underlying sectors (see Table 6). These statistics essentially eliminate concerns that commodity hedge funds have somehow delivered levered long exposure during this recovery. These managers are providing clients something more complex and dynamic, which can be difficult to characterize.
| EW | AW | BCOM | Ags | Energy | Ind | Prec | |
|---|---|---|---|---|---|---|---|
| Equal Weight | |||||||
| Asset Weight | 0.85 | ||||||
| BCOM | -0.05 | 0.03 | |||||
| Agriculture | -0.00 | 0.02 | 0.66 | ||||
| Energy | -0.14 | -0.02 | 0.89 | 0.38 | |||
| Industrial | -0.01 | 0.09 | 0.70 | 0.52 | 0.42 | ||
| Precious | 0.17 | 0.18 | 0.29 | 0.20 | -0.04 | 0.51 |
In our experience, when attempting to communicate what drives performance in the sector, we have found the following points to generally hold:
- Self-described manager opportunity sets vary significantly, reinforcing our claims regarding the diversity of approaches and lack of pairwise correlation
- Commodity volatility may be more correlated with opportunity sets than the price level
- Shifts in commodity forward curves matter and may not be reflected in front-month price changes
- Changing composition and behavior of market participants (hedgers, speculators) can lead to different environments with uncertain impact on front-month prices
We finish with a question: If the opportunity set was well-defined and correlated with front-month prices, what would that imply about alpha available in the sector?
Commodity trend following
Trend followers are a meaningful presence in commodity futures markets. Their performance establishes a baseline for how larger, somewhat slower, and less-fundamental strategies fared over the period.
The commodity portfolio of Soc Gen’s Trend Indicator (SGTI) (a hypothetical and fully transparent implementation of trend) is shown in Figure 9 against the BACHF (EW) and BCOM Indices. While it should be noted we are comparing one hypothetical strategy against an index, the magnitude of the risk-adjusted performance difference is significant.
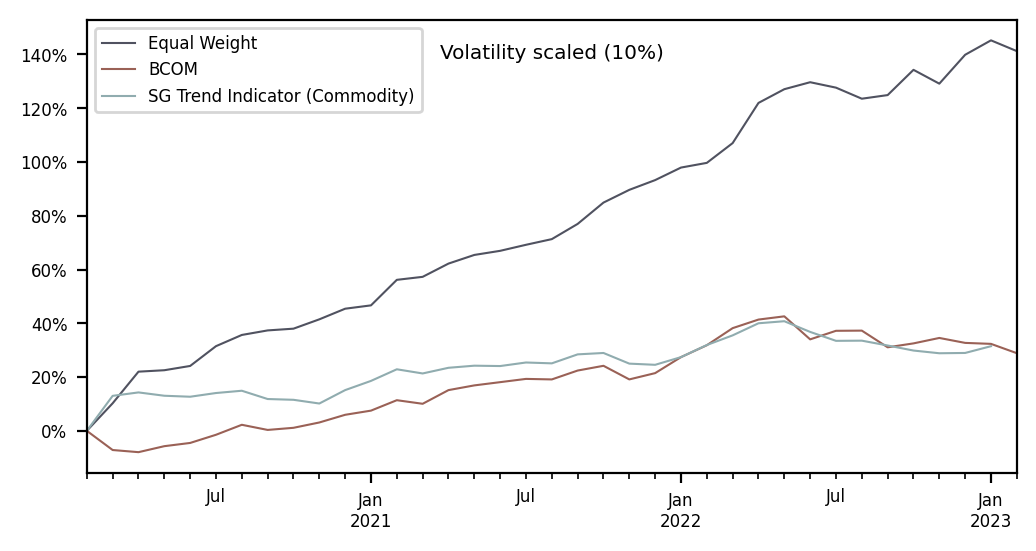
In review, the beginning of 2020 presented commodity hedge funds with falling markets that quickly recovered, bottoming in April of 2020, and eventually forming a meaningful, though historically consistent recovery. Other strategies trading the same markets seemed to have fared well, though the environment was particularly favorable for commodity hedge funds.
How have investors responded?
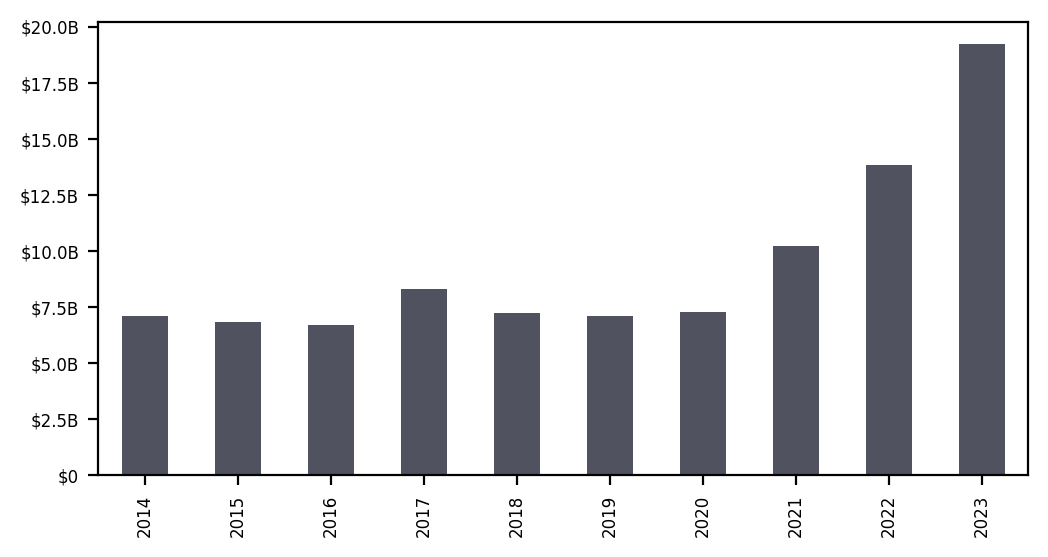
Considering this performance stretch, how have commodity hedge fund investors responded? Total index member assets under management (AUM) have grown significantly, more than doubling from the beginning of 2020 to the beginning of 2023, standing at over $19B today. How was this capital accumulated and by whom?
Below we examine how the composition of assets managed by index members has changed over time and across AUM ranking, sectors, and styles. We conclude with an estimated attribution of AUM changes, seeking to distinguish between growth caused by (1) investor in/outflows and (2) gain/losses.
Index level data
Since 2020, assets under management have increased both from new entrants and growth experienced by current members.
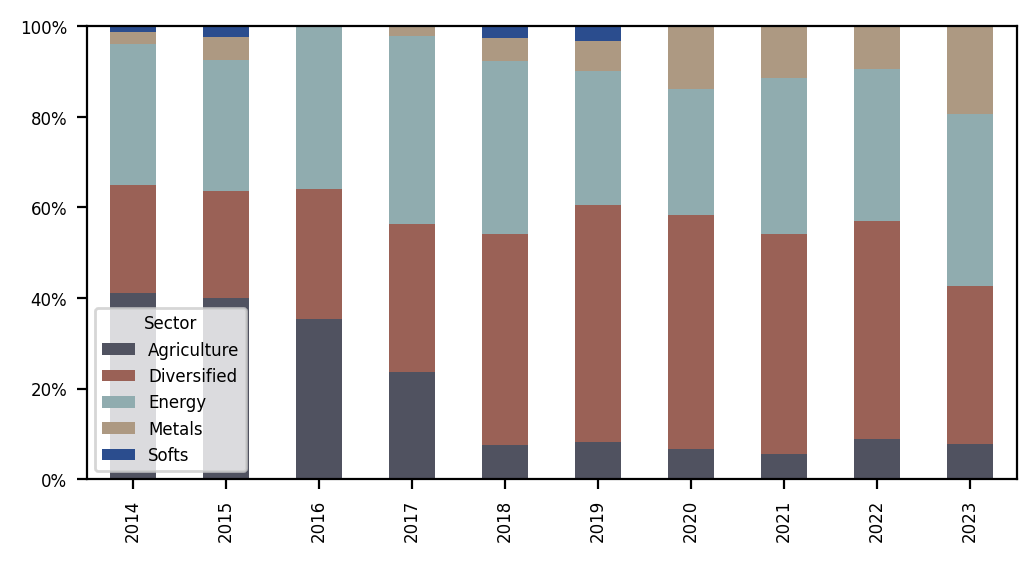
As shown in Figure 11, the composition of assets remains fairly stable over time, with the bulk of assets managed by either diversified or energy-focused funds.
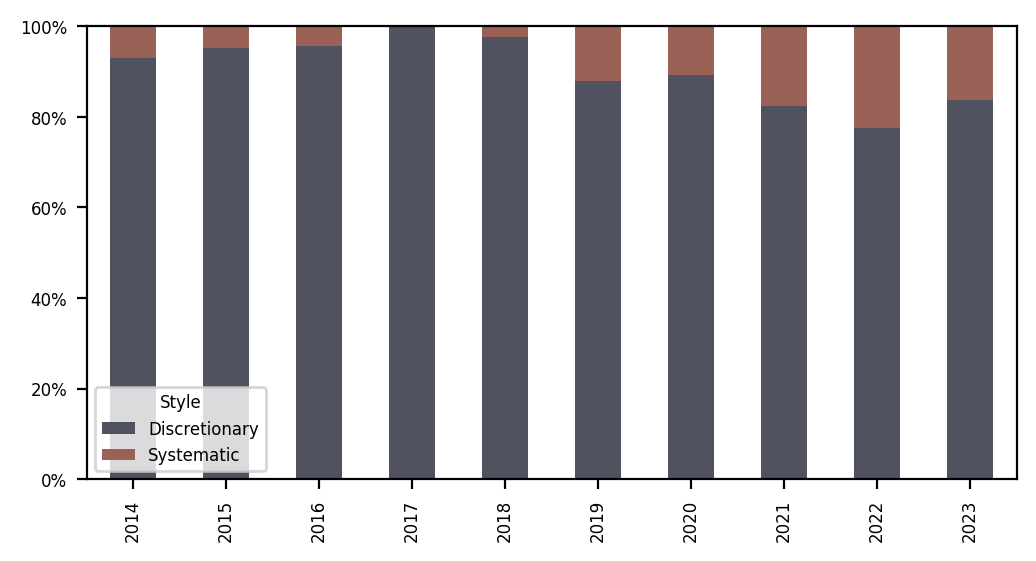
Similarly, while systematic strategies have grown in the past 5 years (Figure 12), the sector primarily remains discretionary in nature. Though regardless of style, member managers today have significant and growing technological and data-oriented resources at their disposal. How they choose to assimilate and respond to information is ultimately what determines their “style.”
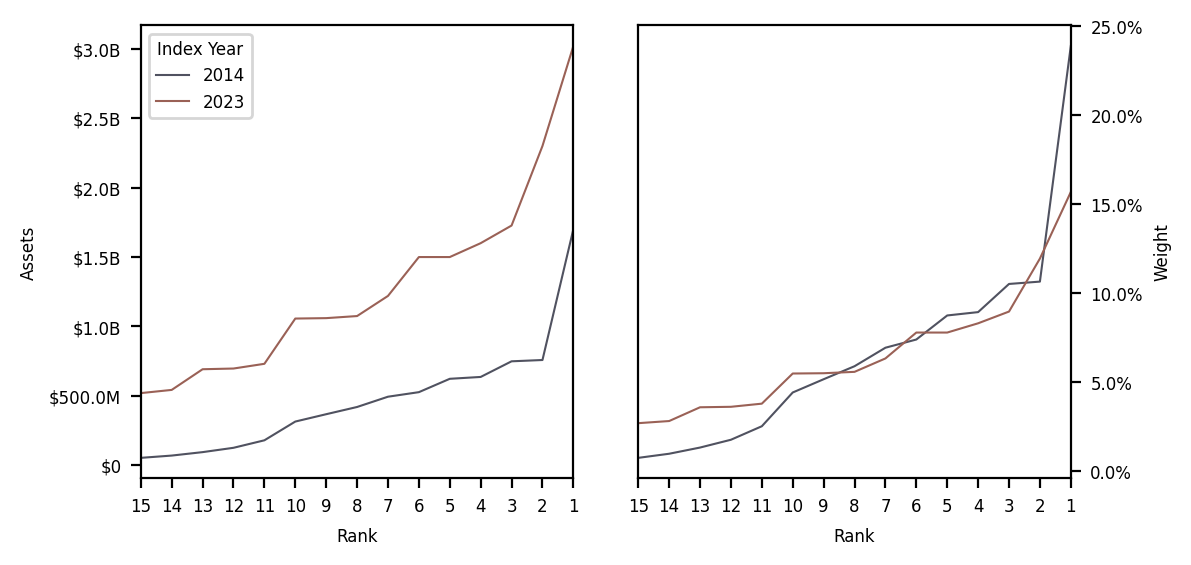
Has the distribution of assets changed?
While the level of assets has increased, the distribution across managers has remained similar, if not slightly flatter. In Figure 13, we sort the constituents by their assets under management and assign them a ranking (1 is largest). We then depict both their dollar (left) and percent (right) weights, in both the first (2014) and most recent (2023) years. Growth in the industry has been proportionate and not dominated by a select few.
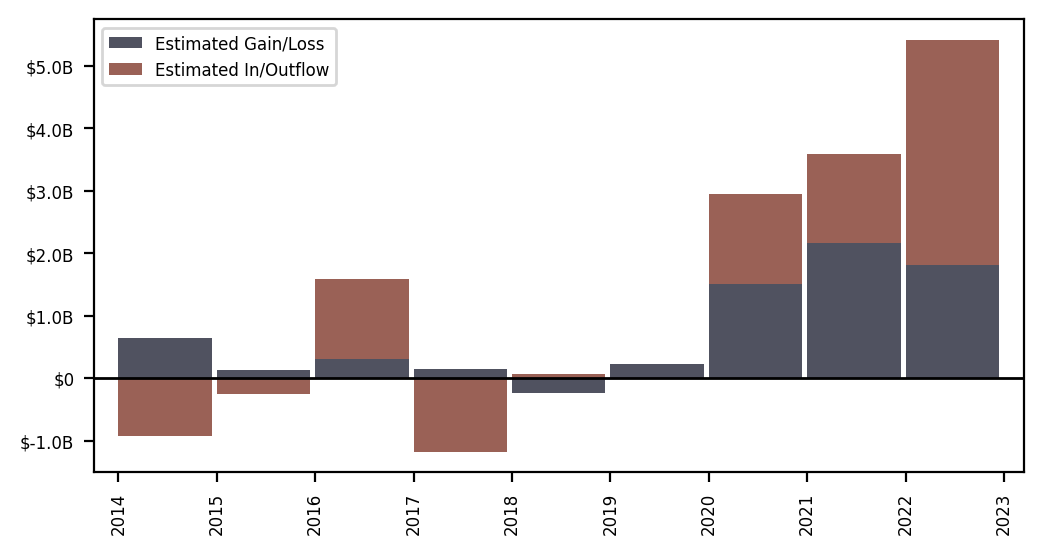
Cumulative flows vs organic growth
Finally, in Figure 14, we depict an analysis of the yearly changes to index member assets since inception. At the beginning of each year, we take each manager’s AUM and grow/shrink it using their next 12 months of net returns. The resulting AUM, which we call “natural AUM”, is summed and compared to the subsequent year’s total reported AUM. If the natural AUM is greater (less) than the reported AUM, we record outflows (inflows). The larger idea is to estimate to what extent assets have changed through gains/losses, as opposed to in/outflows. While such analysis has issues (for one, constituents may change year-to-year) this should reveal major variations through time.
The results are surprising. After years of cumulative investor outflows, inflows began in 2020, accelerating through 2022. Since 2014, we estimate that investors have allocated just over $5B cumulatively, with more than $6B arriving after 2019.
Amazingly, since inception, this analysis shows the majority of the industry’s marked growth is due to gains, totaling nearly $7B over 9 years.
Thoughts on the industry’s future
Commodity hedge funds, especially over the last 3 years, have delivered compelling performance in both percentage and dollar terms. Investors have responded, helping raise assets among members significantly. This seemingly great news may elicit polarized reactions. Long-time participants in the sector may infamously recall the bull market of the late 2000s, increased manager assets, the subsequent bear market’s reduced volatility, and ensuing struggles among funds.
While mostly anecdotal, we see reasons to believe today’s environment may be different:
- BACHFI member assets have grown, nearing $20B, but remain small in relative terms:
- the largest 2 managers (of 10 total) in the Soc Gen Trend Index manage more than $21B
- the Soc Gen CTA Index, comprising the largest 20 managers predominately trading futures, contains no commodity hedge funds
- For various complex reasons, the commodity industry is suffering from a talent shortage. Fewer and fewer institutions are training younger individuals, resulting in a concentrated, though highly experienced talent pool. Many of the BACHFI members traded and managed businesses through the last cycle. It is our experience that commodity hedge fund managers, as a group, are quite protective of their capacity, more typically preferring to maintain edge than gather assets. As evidence, almost all 15 managers in the BACHFI are at or near self-imposed capacity limits.
- Commodities broadly are facing long-term supply challenges. This is a complex topic, but for reasons including financing difficulty, green energy initiatives, and geopolitical concerns, commodity volatility may remain elevated for the medium to long term.
Despite these points, the situation facing commodity hedge fund investors is mixed. While there are reasons to be optimistic about performance in the sector, there are far fewer places to invest today than 3 years ago. Commodity hedge funds are, amazingly, in a state of under-supply. However, the market is responding and new launches are coming. Bridge is extremely excited about the quality of product coming to market.
With increasing investor demand for diversifying strategies driven by inflation, equity valuation, or even geopolitical concerns, we remain long-term bullish on the sector and the unique exposure it can deliver to clients.
Footnotes
- The BACHFI is calculated using two weighting schemes: Asset Weighted (AW) and Equal Weighted (EW). AW may be more helpful when assessing the industry’s total impact, typically in dollars, while EW may be more illustrative of average manager performance.↩︎
- In subsequent work, we will address this question through examinations of larger datasets.↩︎
- As modeled by S&P Total Return, Bloomberg Commodity, and SG Trend indices↩︎
Disclaimer
Bridge Alternatives Securities, LLC is a registered broker-dealer and a member of FINRA and SIPC. Bridge Alternative Investments Inc is a CFTC-registered IIB and a member of the NFA.
This is not a solicitation to buy or sell commodity futures or options on commodity futures and should not be construed as such. Futures and options trading involves substantial risk and is not for everyone. Such investments may not be appropriate for the recipient. The valuation of futures and options may fluctuate, and, as a result, clients may lose more than their original investment.
Nothing contained in this message may be construed as an express or implied promise, guarantee, or implication by, of, or from Bridge Alternatives that you will profit or that losses can or will be limited in any manner whatsoever.
Past performance is not necessarily indicative of future results.
Although care has been taken to assure the accuracy, completeness, and reliability of the information contained herein, Bridge Alternatives makes no warranty, express or implied, or assumes any legal liability or responsibility for the accuracy, completeness, reliability, or usefulness of any information, product, service, or process disclosed.
The risk of loss in trading commodity interests can be substantial. You should therefore carefully consider whether such investing is suitable for you in light of your financial condition. Past performance is not necessarily indicative of future results.